
Last Updated: 01 Aug 2026
How to cite this page: If you use data from this page in your own content, please link back to Mailotrix.com as your source. That helps us keep building free resources like this one.
Let’s be honest: email is the cockroach of marketing channels. Every year someone declares it dead, and every year it just… keeps cashing checks. Social media algorithms have mood swings. SEO changes its mind every six months. But email? Email just sits in your inbox, patiently waiting, like a golden retriever that knows dinner is coming eventually.
I went down a rabbit hole pulling together the freshest 2026 numbers on open rates, ROI, timing, personalization, and all the other stuff that actually moves the needle. Consider this your cheat sheet — the kind you’d want if someone was quizzing you at a marketing meetup and you didn’t want to be the person going “uhh, email’s still good, right?”
First, the Headline Stat: Email Still Prints Money
If you only remember one number from this whole post, make it this one: email marketing returns somewhere between $36 and $42 for every $1 you spend, and in some retail and ecommerce benchmarks that climbs as high as $45. Some platforms report their own users doing even better — Omnisend, for instance, has cited numbers closer to $76–79 per dollar for merchants on its paid plans.
Compare that to paid search (~$2), social ads (~$2.80), and display ads (~$1.35), and you start to understand why marketers keep circling back to email even when it’s not the trendiest kid at the party. Nothing else comes close, and honestly, the gap seems to be widening, not shrinking, as AI tools help squeeze even more revenue out of every send.
Basically: if your CFO ever asks why you’re still bothering with a newsletter, this is your answer.
Open Rates: A Number That Lies to You (Sort Of)
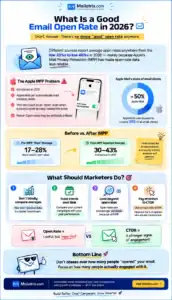
Here’s where things get spicy. If you ask ten different sources “what’s a good email open rate in 2026,” you’ll get ten different answers, ranging anywhere from the low 20s to the low 40s. That’s not because marketers can’t agree on basic math — it’s because of one very annoying culprit.
Apple’s Mail Privacy Protection (MPP). Since Apple started auto-loading email content in the background back in 2021, “opens” reported by Apple Mail users don’t necessarily mean a human actually looked at your email. A bot loaded the pixel. Nobody was home. And since Apple Mail makes up somewhere around 50% of all email clients these days, this isn’t a rounding error — it’s a full-blown funhouse mirror on your dashboard.
So what do you actually do with that? A few honest takeaways:
- The “real,” pre-MPP average open rate historically sat closer to 17–28%.
- Post-MPP dashboards now often show inflated numbers in the 30–43% range industry-wide.
- Your own historical data is a far better benchmark than any industry-wide number, because at least it’s consistently distorted in the same direction.
- Click-to-open rate (CTOR) — the percentage of openers who actually clicked something — is quickly becoming the metric people actually trust.
Translation: stop bragging about your open rate at parties. Start bragging about your CTOR instead. It’s the metric equivalent of trading in a car with a broken odometer.
Not All Emails Are Created Equal
This is the part people skip, and it’s kind of the whole point. Comparing a promotional blast to a welcome email is like comparing a first date to a marriage — wildly different expectations, wildly different outcomes.
- Welcome emails are the overachievers of the bunch, regularly hitting open rates north of 80%. People just signed up. They’re excited. They still like you.
- Triggered/behavioral emails (the “hey, you left this in your cart” type) land somewhere around 45% open rates — still strong, because they’re relevant and timely.
- Newsletters and regular campaigns settle into a more modest ~30–40% range, depending on your list and industry.
- Transactional emails (order confirmations, password resets) crush everything else, often hitting 55–70%+, mostly because people genuinely need that information right now.
The lesson: if your open rates feel disappointing, check whether you’re comparing a mass promo to someone else’s welcome-email stats. That’s not a fair fight, and you’re not the problem.
Industry Benchmarks: Know Your Lane
Your “good” open rate depends heavily on what you sell. A 30% open rate is a triumph for an ecommerce brand and a mediocre Tuesday for a nonprofit.
Generally speaking:
- Nonprofits and faith-based organizations tend to sit at the top of the leaderboard, often in the 45–60% range — people who’ve opted in to hear from a cause they care about tend to actually open those emails.
- Government and education sectors also perform well above average, frequently landing in the high 20s to mid-30s.
- Ecommerce and retail sit lower, often in the 18–32% range, partly because so many of those emails land in Gmail’s Promotions tab instead of the main inbox.
- B2B and tech vary a lot by source, but most benchmarks put them somewhere in the 18–22% territory when measured on stricter, pre-MPP terms.
If your numbers don’t match some generic “average,” that’s fine. Find your actual peer group before you panic.
What Actually Moves the Needle
Okay, so what do you do with all this? A few levers consistently show up across every source I looked at:
Personalization still works. Adding a subscriber’s name (or better yet, relevant behavioral data) to a subject line reliably lifts open rates by somewhere in the 25–35% range, and click-through rates jump even more. This isn’t new advice, but apparently most brands still don’t bother doing it consistently — which, frankly, is good news for you if you actually do.
Timing matters more than people think. Tuesday through Thursday consistently beats Monday and Friday sends. Traditional wisdom says mid-morning is prime time, but a growing pile of data suggests evening sends — especially around 8 PM — are quietly outperforming the 9-to-5 window, likely because that’s when people are scrolling on their phones instead of their work laptops.
Segmentation is a cheat code. Sending targeted campaigns to smaller, more relevant groups instead of blasting your entire list can lift revenue by several hundred percent in some benchmarks. It’s more work upfront, but the payoff is real.
Mobile is no longer optional — it’s the default. Somewhere between 42% and 55% of all email opens now happen on a mobile device, depending on the dataset. If your email looks broken on a phone, you’re losing a huge chunk of your audience before they even get to your call-to-action.
AI is quietly changing the game. AI-generated subject lines are outperforming human-written ones in a lot of recent benchmarks, and when paired with AI-driven send-time optimization, some sources report a combined lift approaching 40%. Whether or not you love AI writing your copy, ignoring the send-time optimization part alone seems like leaving money on the table.
The Real Talk Section
Look — none of this works if your subject line is boring, your content doesn’t deliver on its promise, or you’re sending the same generic blast to everyone on your list regardless of what they actually want. Stats can point you in the right direction, but they can’t write your emails for you (well, unless you let AI do that too).
A few habits worth stealing:
- Keep your subject line focused — somewhere in the low-to-mid 40s in character count tends to render well across most devices and clients.
- Use a real call-to-action, not just a link buried in a paragraph.
- Don’t hide behind your open rate. Track click-to-open rate and revenue per email instead — those numbers can’t be faked by a background pixel load.
- Test your own send times instead of blindly copying “Tuesday at 10 AM,” since that exact slot is also the most crowded one in everyone else’s inbox.
Email marketing isn’t dead, it’s not dying, and it’s honestly not even really struggling. It’s just gotten a little more complicated to measure — which, if you ask me, is a pretty small price to pay for a channel that still returns $36+ for every dollar you throw at it.
Stats pulled from a range of 2025–2026 industry benchmark reports including MailerLite, GetResponse, Litmus, Omnisend, Klaviyo, HubSpot, and others. Given how fast this space moves (and how much Apple keeps messing with everyone’s dashboards), treat these as directional — always benchmark against your own historical performance first.
About This Page
How I collected this data: Every stat on this page was pulled from a published benchmark report, platform study, or industry survey by a named organization. I linked to the original source next to each number. Where exact source URLs were not public, I cited the research body by name.
A note on Apple MPP: Several stats on this page come from datasets that include post-MPP data. Where relevant, I flagged this in the section on Apple’s privacy changes. Pre-2021 figures and post-2021 figures are not directly comparable, and I have tried to make that clear throughout.
When this was last updated: June 2026.
How to cite this page: If you use data from this page in your own content, please link back to Mailotrix.com as your source. That helps us keep building free resources like this one.
Digital Marketing Statistics (2026)
101 Ecommerce Email Marketing Statistics
100+ Lead Generation Statistics
101 Marketing Automation Statistics
