Last Updated: 21 Jun 2026
How to cite this page: If you use data from this page in your own content, please link back to Mailotrix.com as your source. That helps us keep building free resources like this one.
Email open rates are one of the most closely watched metrics in email marketing.
After all, if nobody opens your emails, nothing else matters. Your subscribers can’t click your links, read your content, or buy your products if they never open the message in the first place.
But what is a good email open rate? How do open rates vary across industries? And what factors have the biggest impact on whether someone opens an email or ignores it?
To answer these questions, I’ve collected the latest email open rate statistics from trusted industry reports, studies, and research sources.
Whether you’re a blogger, marketer, business owner, or agency, these numbers will help you benchmark your performance, understand current trends, and find opportunities to improve your email marketing results.
Let’s dive into the data.
Quick Stats: What You Need to Know Right Now
| Stat | Number | Source |
|---|---|---|
| Average email open rate (2025) | 43.46% | MailerLite |
| Average open rate before Apple MPP | ~21% | Mailchimp |
| Welcome email open rate | 83.63% | GetResponse |
| Abandoned cart email open rate | 50.5% | Klaviyo |
| Open rate lift from personalized subject lines | +26% | Campaign Monitor |
| Mobile share of all email opens | 55% | Litmus |
| Best subject line length for opens | 61-70 characters | GenesysGrowth |
| Best days to send email | Tuesday – Thursday | MailerLite |
| Highest-performing industry (open rate) | Religion — 59.70% | Mailmend |
| Lowest-performing industry (open rate) | E-commerce — 26.64% | Klaviyo |
What Is the Average Email Open Rate?
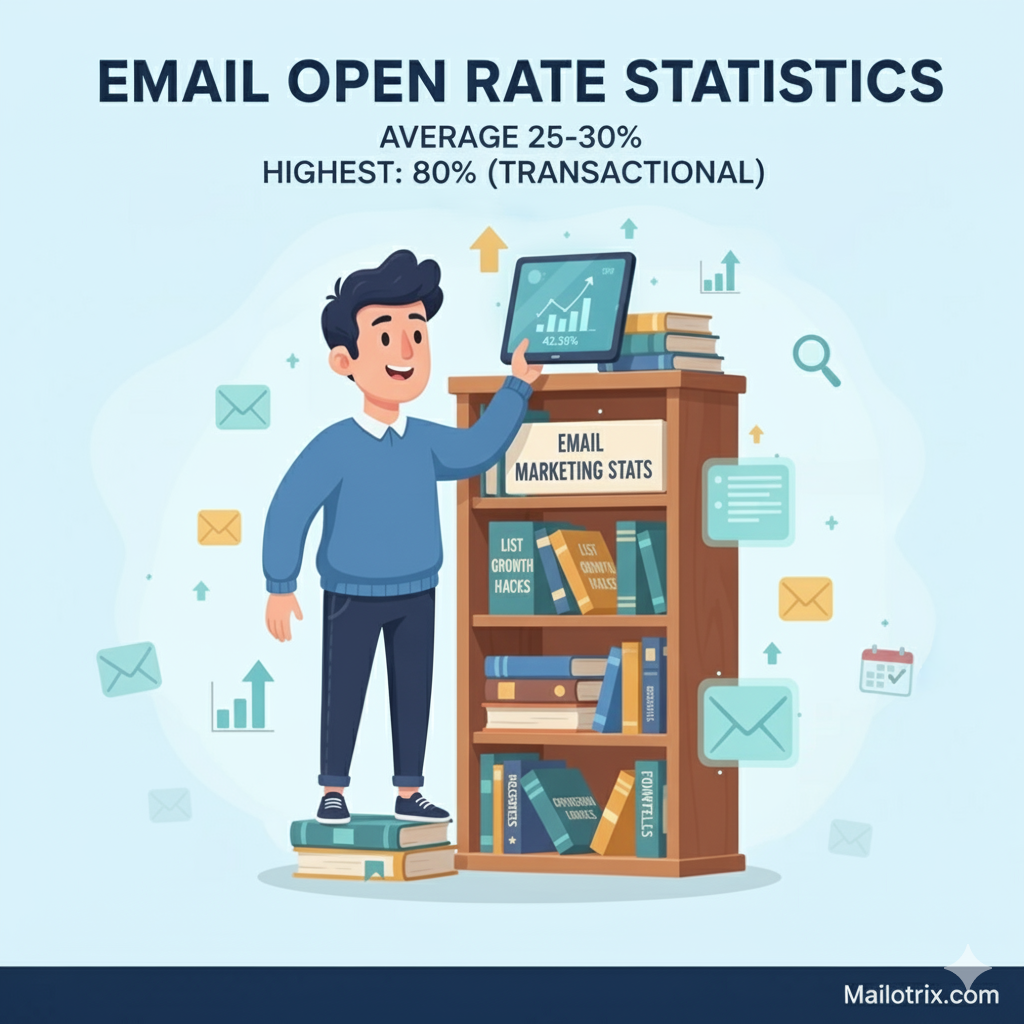
Quick Answer: The average email open rate in 2026 is 43.46% across all industries, based on over 3.6 million campaigns. But this number is inflated by Apple’s Mail Privacy Protection. A more accurate pre-inflation average is closer to 21-25%.
- The average email open rate across all industries in 2025 was 43.46%, based on MailerLite’s analysis of over 3.6 million campaigns from 181,000+ accounts. — MailerLite, Email Marketing Benchmarks 2025
- That same benchmark was 42.35% in 2024, also based on MailerLite’s dataset of 3.3 million campaigns across 155,182 accounts. — MailerLite, Email Marketing Benchmarks 2024
- Before Apple Mail Privacy Protection changed how opens are counted in 2021, the industry-wide average open rate across all industries was 21.33%. — Mailchimp, Email Marketing Benchmarks
- Open rates across industries range widely — from a low of 30.1% to a high of 55.71% in MailerLite’s 2025 dataset. — MailerLite, Email Marketing Benchmarks 2025
- A good open rate for most businesses falls between 17% and 28% when using pre-MPP measurement standards. When open rates are in this range, a campaign is generally considered a success. — Mailmunch
- In B2B email marketing specifically, the median open rate in 2025 sits between 36.7% and 42.35%, up from 34.2% in 2024. — Verified.email, B2B Benchmarks Report 2025
- The average click-to-open rate (CTOR) across all industries in 2025 was 6.81% — meaning roughly 7 out of 100 people who opened an email actually clicked something inside it. — MailerLite, Email Marketing Benchmarks 2025
- The average email click-through rate (CTR) across all industries in 2025 was 2.09%. — MailerLite, Email Marketing Benchmarks 2025
- The average unsubscribe rate in 2025 was 0.22% — more than double the 2024 figure of 0.08%, largely due to Gmail making it easier for people to unsubscribe in one click without even opening an email. — MailerLite, Email Marketing Benchmarks 2025
- 99% of email users check their inbox every day. 58% check it first thing in the morning. — Porch Group Media
What the data shows: The “average” open rate number you see today is not the same number from 3 years ago. Apple changed the measurement in 2021. The 43% figure and the 21% figure are both real — they just measure different things. Use your own historical data as your real benchmark.
What Is a Good Open Rate for the Type of Email You Send?
Quick Answer: It depends entirely on the email type. Welcome emails average 83.63% open rates. Triggered behavioral emails average 45.38%. Regular newsletter campaigns average around 40%. One-off promotional blasts average the lowest of all.
- Welcome emails have an average open rate of 83.63% — the highest of any email type tracked in GetResponse’s benchmark data. — GetResponse, Email Marketing Benchmarks 2024
- Welcome emails also achieve an average click-through rate of 16.60%, making them the single highest-performing email in most companies’ entire sequences. — GetResponse, Email Marketing Benchmarks 2024
- Triggered emails — emails sent based on a specific action the reader takes — have an average open rate of 45.38%. — GetResponse, Email Marketing Benchmarks 2024
- Newsletter campaigns average a 40.08% open rate and a 3.84% click-through rate, according to GetResponse’s benchmark data. — GetResponse, Email Marketing Benchmarks 2024
- Abandoned cart emails achieve an average open rate of 50.5%, a click rate of 6.25%, and a conversion rate of 3.33%. Top-performing brands reach conversion rates of 7.69%. — Klaviyo, 2024 Benchmark Report
- In the e-commerce sector specifically, welcome emails in 2025 average a 54.3% open rate. — Amra & Elma
- Behavior-based emails generate roughly 3x higher engagement than scheduled campaigns. — InboxAlly
- A single autoresponder email — a one-email automated sequence — has recorded an average 98% open rate and a 37% click-through rate in some datasets, though this is heavily influenced by the recency of sign-up and sender reputation. — Porch Group Media
- Order confirmation and transactional emails — emails tied to a purchase or action — see open rates of 60% to 70%, nearly 3x the industry average for promotional emails. — MailerTogo, Transactional Email Open Rates 2025
- Password reset emails average open rates of 55% to 60%+, because users need to act immediately. — MailerTogo, Transactional Email Open Rates 2025
What the data shows: The type of email you send matters more than almost any other variable. A welcome email will almost always outperform a promotional blast. If you want better open rates, send more triggered, behavior-based emails and fewer mass broadcasts.
Email Open Rates by Industry
Quick Answer: Industry determines your benchmark more than anything else. Religion and nonprofits regularly hit 46-60% open rates. E-commerce struggles at 26-32%. Know your category before you judge your numbers.
- The religion and faith-based sector has the highest average email open rate of any industry at 59.70%. — Mailmend
- Nonprofit organizations average 46.49% open rates — well above most commercial categories — because their subscribers actively want updates and have a personal connection to the mission. — Mailmend
- Travel and hospitality emails average 45.21% open rates, driven by strong subscriber interest in deals and destination content. — Mailmend
- Education and training companies see an average open rate of 35.64%. — Amra & Elma
- Business and finance companies experience an average open rate of 31.35%. — Amra & Elma
- General retail averages a 38.58% open rate, according to Klaviyo’s data — higher than pure e-commerce because retail emails tend to have a more diverse content mix beyond promotions. — Klaviyo, 2024 Benchmark Report via Mailmend
- E-commerce brands see open rates between 26.64% and 31.08%, well below the all-industry average — largely because promotional emails land in Gmail’s Promotions tab instead of the Primary inbox. — Klaviyo, 2024 Benchmark Report
- Fashion brands specifically average 32.1% open rates. — Mailmend
- Sports and recreation brands in e-commerce see some of the highest open rates at 40.6%, according to Klaviyo’s data. — Klaviyo, 2024 Benchmark Report via Flowium
- Government and public sector emails average around 28.77% open rates. — Mailmunch
- Communications companies achieved the highest open rates in GetResponse’s 2023 benchmark data at 65.1%, up from 48.8% the year before. — GetResponse, Email Marketing Benchmarks
- B2B services companies see 18-22% open rates when measured against pre-MPP standards, which professional audiences check regularly because they expect relevant, targeted content. — Monday.com Blog
- Emails that land in Gmail’s Primary inbox achieve open rates up to 21% higher than the same email landing in the Promotions tab. — Mailmend
What the data shows: Comparing your open rate to a generic industry average is almost useless. A 30% open rate is a failure for a nonprofit and a win for an e-commerce brand. Find your specific industry benchmark first — then compete against that.
What Affects Email Open Rates the Most?
Quick Answer: Four things move open rates more than anything else: your subject line, who the email is from, when you send it, and whether the email is personalized. Fixing any one of these can lift opens by 20% or more.
Subject Lines
- 47% of recipients say they open an email based on the subject line alone. — InsiderOne, Average Email Open Rates 2026
- 45% of recipients open emails based on who the email is from — meaning your sender name often matters as much as the subject line. — Porch Group Media
- The average email subject line is 6 words long. But the best-performing subject lines are only 2 to 4 words. — MailerLite Blog
- Subject lines between 61 and 70 characters achieve the highest average open rate at 43.38% — the highest of any length category tested. — GenesysGrowth
- The best-performing subject line keywords include: welcome, video, bonus, exclusive, discount, announcement, confirmation, and congratulations. — MailerLite Ultimate Subject Line Guide
- Using spam trigger words like “Free!!!” or “Urgent” in all caps — or multiple exclamation marks — can send emails to the junk folder and hurt your sender reputation over time. — HubSpot, Average Email Open Rate Benchmark
Personalization
- Personalized subject lines increase email open rates by 26%. — Campaign Monitor, Email Marketing Benchmarks 2024
- Emails with personalized subject lines have an open rate of 18.30%, compared to 15.70% for emails without any personalization. — Amra & Elma
- Personalized emails have 29% higher unique open rates and 41% more unique click rates than non-personalized emails. — Porch Group Media
- By addressing a recipient by their name, you can increase open rates and clicks by up to 35%. — Porch Group Media
- Personalized emails deliver 6x higher transaction rates than generic emails. — Experian, Email Marketing Study 2024
- 74% of marketers say targeted personalization increases customer engagement. — eConsultancy, Email Marketing and Personalization Report 2024
- 43% of recipients say they ignore emails that feel impersonal or generic. — Hunter.io
- The top three reasons marketers use personalization are: improved open rates (82%), higher click-through rates (75%), and better customer satisfaction (58%). — Porch Group Media
Timing
- Emails sent on Tuesdays and Thursdays see the highest open rates of any day of the week. — MailerLite Blog
- Monday and Friday sends perform 20% lower than mid-week sends across industries. — GenesysGrowth
- During the work week, engagement peaks between 3 PM and 7 PM local time. On weekends, 9 AM generates the most opens. — MailerLite Blog
- Evening sends at 8 PM show a 59% open rate — higher than traditional business hours — reflecting the shift toward people checking email on mobile after work. — GenesysGrowth
- In Omnisend’s dataset, 8 PM was the single highest-performing send time for opens in 2025. — Omnisend, 2025 Ecommerce Marketing Report
- Emails sent multiple times per week have a lower open rate than those sent monthly or less. However, the click-to-open rate does not change much with frequency. — MailerLite, Email Marketing Benchmarks 2025
Segmentation
- Segmented email campaigns generate 30% more opens and 50% more click-throughs than non-segmented campaigns. — Mailchimp, Email Marketing Benchmarks
- Campaigns targeting fewer than 50 recipients average a 5.8% reply rate, compared to 2.1% for campaigns sent to over 1,000 recipients. Smaller, highly targeted lists consistently outperform mass sends. — InboxAlly
- Marketers using advanced segmentation see a 760% increase in revenue compared to non-segmented campaigns. — Campaign Monitor, Email Marketing Benchmarks 2024
Mobile
- 55% of all email opens now happen on mobile devices. — Litmus, State of Email 2024
- 59% of Millennials primarily use their phones to check email. — Amra & Elma
- 65% of opens happen on mobile in some dataset measurements — with the exact number varying by industry and audience. — Mailmend
Emojis
- Including emojis in subject lines can increase open rates by up to 56% compared to text-only subject lines — but results vary heavily by industry. — Campaign Monitor, 2024
- Whether emojis help or hurt depends on your specific audience and brand. MailerLite found the impact varies significantly across different sectors. — MailerLite Blog
What the data shows: Most open rate problems come down to three things: a weak subject line, sending to the wrong people, or sending at the wrong time. Fix those three things before changing anything else.
How AI Is Changing Email Open Rates
Quick Answer: AI-generated subject lines increase open rates by 26% over human-written ones. When you combine AI subject lines with AI-driven send time optimization, total lift reaches around 40%. This is the fastest-growing way to improve open rates right now.
- AI-generated subject lines outperform human-written subject lines by 26% on average. — Phrasee / HubSpot
- When AI subject line optimization is combined with AI-driven send time optimization, total open rate lift reaches roughly 40% over unoptimized campaigns. — DigitalApplied, Email Marketing Statistics 2026
- Revenue increased by 41% and click-through rates increased by 13.44% for marketers who use AI for email personalization. — HubSpot, State of Marketing & Trends Report 2024
- 95% of marketers who use generative AI for email creation rate it “effective” — and 54% rate it “very effective.” — Porch Group Media
- 64% of marketers now use AI for at least one part of their email marketing workflow. — DigitalApplied, Email Marketing Statistics 2026
- By late 2026, 61% of enterprise email programs are projected to use AI for at least one element of campaign creation. — DigitalApplied, Email Marketing Statistics 2026
What the data shows: AI is not replacing email marketers. It is making the most time-consuming parts — writing subject lines, picking send times, personalizing content — faster and more accurate. The gap between teams using AI and teams that are not is already visible in the open rate data.
The Apple MPP Problem: Why Open Rate Data Is Broken
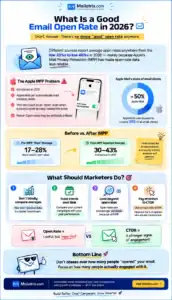
Quick Answer: Apple’s Mail Privacy Protection (MPP), launched in September 2021, pre-loads email content for Apple Mail users even if they never open the email. This inflates open rates across the industry. Apple Mail now makes up about 50% of all email clients, so this distortion is massive.
- Apple’s Mail Privacy Protection now affects 50% to 60% of all recorded email opens, inflating open rate data across the entire industry. — Litmus, State of Email 2024
- A study of over 80,000 email marketing accounts found that open rates jumped 18 percentage points — to over 40% — within six months of Apple MPP launching in 2021. — HubSpot, Average Email Open Rate Benchmark
- Apple Mail accounts for approximately 46-50% of all email clients, meaning roughly half of all “opens” recorded today may not reflect a real human opening an email. — HubSpot, Average Email Open Rate Benchmark
- As a direct result of MPP, most smart email marketers now use click-through rate, click-to-open rate, and revenue per email as their primary performance metrics — not open rate. — HubSpot, Average Email Open Rate Benchmark
- Open rates are still directionally useful for measuring deliverability trends — just not accurate enough to rely on as a standalone number. — MailerLite, Email Marketing Benchmarks 2025
- Other technical factors that inflate open rates include: image-blocking email clients that fire tracking pixels on load, preview panes that count as opens without a real read, and security bots that scan emails and trigger false opens. — Monday.com Blog
What the data shows: The 43% average open rate you see in 2025 is not what it looks like. It is the same inbox behavior as before — just measured differently. If your open rate jumped dramatically after September 2021 without a change in your strategy, that was Apple, not you.
What Metrics Should You Track Instead of Open Rate?
Quick Answer: Click-to-open rate (CTOR), revenue per email, and conversion rate are now more reliable than open rate alone. They tell you what actually happened after the email was opened.
- Click-to-open rate (CTOR) is now considered by most email professionals to be the most reliable measure of email content quality — because it only counts clicks from real humans who actually opened the email. — HubSpot, Average Email Open Rate Benchmark
- The average CTOR across all industries in 2025 was 6.81% — meaning about 7 out of every 100 people who opened an email clicked something. — MailerLite, Email Marketing Benchmarks 2025
- Emails in Australia had the highest CTOR at 8.3% in MailerLite’s 2025 dataset. Asia had the lowest at 5.21%. — MailerLite, Email Marketing Benchmarks 2025
- Email marketing delivers an average ROI of $36 to $42 for every $1 spent in 2026 — the highest return of any digital marketing channel. — Litmus, Email Marketing ROI Study 2024
- Adding a video to your email can increase open rates by 300%, and video thumbnails increase clicks by 22% on average. — Porch Group Media
- Changing a call-to-action button from second-person (“click here”) to first-person (“get my free guide”) improves clicks by 90%. — Porch Group Media
- Including a CTA button in an email instead of a text link increases conversion rates by up to 28%. — Porch Group Media
What the data shows: Open rate tells you if your subject line worked. CTOR tells you if your content worked. Revenue per email tells you if any of it mattered. Track all three — but do not make decisions based on open rate alone in 2025 and beyond.
Email Open Rate Statistics: Key Takeaways
Here is what all this data comes down to, in plain language:
The average open rate is not what it used to be. The 43% industry average in 2025 is real data from real campaigns — but Apple’s privacy changes have made the raw number hard to compare to anything from before 2021. Your baseline for comparison is your own historical data, not the industry figure.
Email type matters more than anything you can test. A welcome email will almost always beat a newsletter. A triggered behavioral email will beat a broadcast promotion. Before you test subject lines or send times, make sure you are sending the right type of email first.
Your industry benchmark is your real target. A 30% open rate is great for e-commerce and weak for a nonprofit. A 20% open rate is normal for B2B and alarming for a faith-based organization. Find your specific industry number and compete against that — not the global average.
Personalization is still the highest-leverage lever. Adding someone’s name to a subject line lifts opens by 26-35%. Personalizing the whole email lifts transaction rates by 6x. This is not a new insight — but most businesses still do not do it consistently.
The best time to send is not Monday morning. Tuesday through Thursday outperforms the rest of the week. Evenings — especially 8 PM — are beating traditional business hours as mobile usage shifts when people check email. Test timing before assuming.
Open rate is a starting point — not a final answer. Click-to-open rate and revenue per email tell you the real story. An email with a 50% open rate and a 0.5% CTOR performed worse than an email with a 25% open rate and a 5% CTOR. Always look downstream.
About This Page
How I collected this data: Every stat on this page was pulled from a published benchmark report, platform study, or industry survey by a named organization. I linked to the original source next to each number. Where exact source URLs were not public, I cited the research body by name.
A note on Apple MPP: Several stats on this page come from datasets that include post-MPP data. Where relevant, I flagged this in the section on Apple’s privacy changes. Pre-2021 figures and post-2021 figures are not directly comparable, and I have tried to make that clear throughout.
When this was last updated: June 2026.
How to cite this page: If you use data from this page in your own content, please link back to Mailotrix.com as your source. That helps us keep building free resources like this one.