
Last Updated: 25 Jun 2026
Building an email list is one of the smartest investments you can make in your business.
Unlike social media platforms, where algorithms control who sees your content, your email list gives you a direct way to reach your audience whenever you want.
But how fast are businesses growing their email lists? Which list-building strategies work best? How many subscribers do marketers typically have? And what tactics are driving the highest conversion rates?
To answer these questions, I’ve collected the latest email list building statistics from trusted industry reports, surveys, and research studies.
Whether you’re a blogger, creator, marketer, business owner, or agency, these numbers will help you understand current trends, benchmark your growth, and discover new ways to grow your email list faster.
Let’s dive into the data.
How to cite this page: If you reference data from this page in your own content, please link back to Mailotrix.com as the source. That helps us keep building free, research-backed resources like this one.
Table of Contents
ToggleQuick Stats: What You Need to Know Right Now
| Stat | Number | Source |
|---|---|---|
| Global email users (2024) | 4.48 billion | Statista |
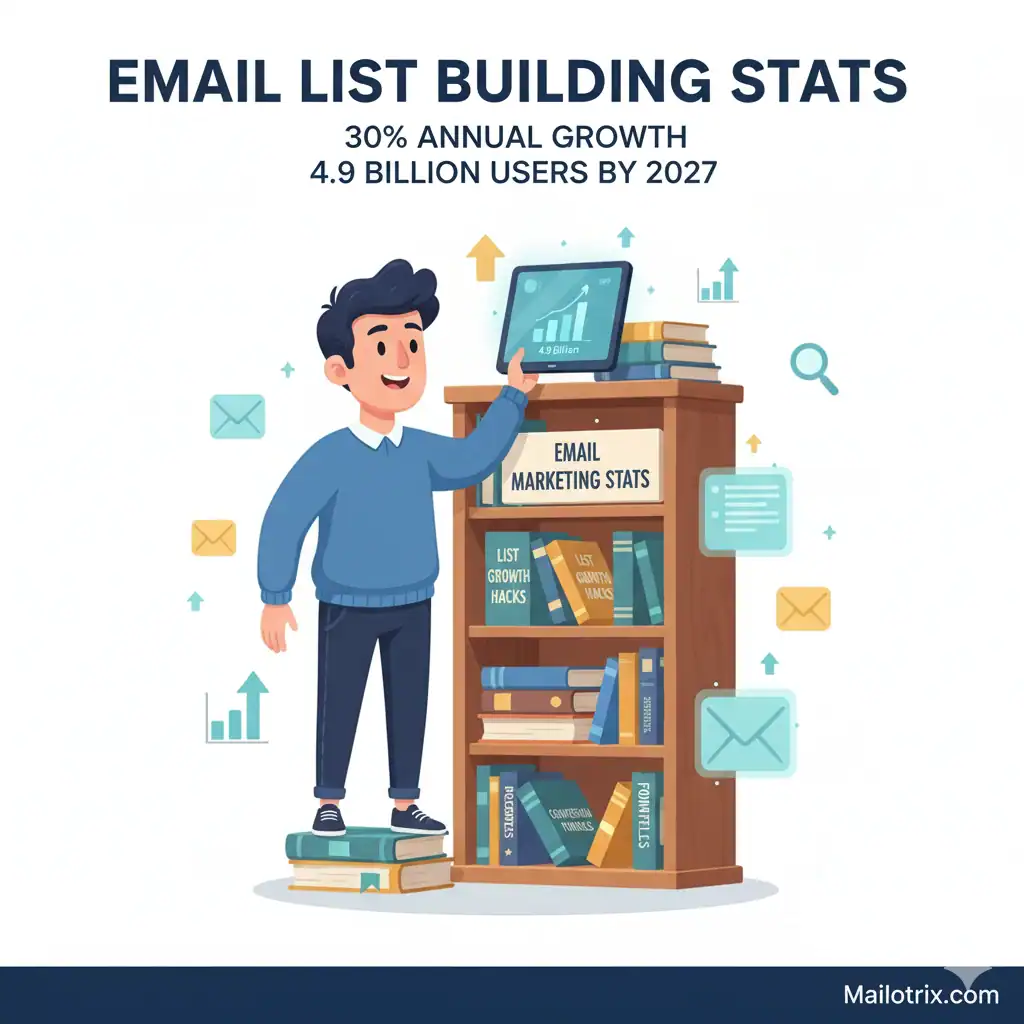
| Global email users projected (2027) | 4.89 billion | Statista |
| Average email list decay rate per year | 20% to 30% | Opensend |
| Healthy monthly list growth rate | 2.5% | Shopify |
| Average opt-in rate across all sites | 1.95% | Sumo |
| Top performers’ opt-in rate | 6.5% | Sumo |
| Conversion lift from adding a lead magnet to a popup | +100% to +155% | Getsitecontrol |
| Email ROI per $1 spent | $36 to $42 | Litmus |
| Email list churn for for-profit businesses | ~30% per year | CDP Community |
| Addresses that go bad annually (list decay) | 22.5% | Opensend |
Why Your Email List Is the Most Valuable Asset in Digital Marketing
Quick Answer: There are 4.48 billion email users worldwide — more than any social platform on earth. Email converts at 4.24% versus 2.49% for search and 0.59% for social. And it delivers $36 to $42 for every $1 spent. No other channel comes close.
- There were 4.48 billion global email users in 2024, growing toward 4.6 billion in 2025 and 4.89 billion by 2027 — providing the largest and still-growing addressable audience of any digital channel. — Statista via Shopify
- 376.4 billion emails are sent every day in 2025. That number is expected to hit 408 billion by 2027. — Statista via DesignModo
- In 2024, people sent 251,100,000 emails per minute — more than any other form of digital communication. — Porch Group Media
- 93% of people use their email every day. 42% check it three to five times a day. 58% say email is the first thing they check online every morning. — DesignModo
- Email traffic converts to purchases at 4.24%. Search traffic converts at 2.49%. Social media traffic converts at just 0.59%. — GrowthNavigate, Email Marketing Statistics 2025
- Email marketing delivers an average ROI of $36 to $42 for every $1 spent — the highest return of any digital marketing channel, regardless of industry. — Litmus, 2025
- 90% of Americans are subscribed to at least one email newsletter. 74% receive newsletters from 1 to 10 different senders. — Storydoc via The CMO
- 4 out of 5 marketers say they would rather give up social media than give up email marketing. — HubSpot, State of Marketing 2024
- 50% of consumers in 2024 said they purchased directly from an email — more than from social media posts or ads combined. — DesignModo
- Previous customers are 50% more likely to make a purchase than a new contact — making your existing email list not just an acquisition tool but your highest-probability sales channel. — ZeroBounce
- 77% of B2B companies use an email newsletter as part of their content marketing strategy. — OptinMonster via The CMO
- 87% of B2B marketers use email to drive new leads. 31% say it is their top revenue-generating channel. — SuperOffice via The CMO
What the data shows: Email is not just another marketing channel. It is the channel that outperforms everything else on the metrics that actually matter — conversions, revenue per send, and return on investment. Building your list is not optional if you want a business that compounds over time.
Email List Growth Rate Statistics
Quick Answer: The average monthly email list growth rate across all industries is 2.5%. E-commerce lists grow 2% to 5% per month. Technology lists grow 3% to 6%. But every list also decays 20% to 30% per year through natural churn — meaning you need consistent growth just to stay flat.
- The average email list growth rate across all industries is approximately 2.5% per month. — Shopify, Email Marketing Metrics 2025
- E-commerce email lists typically grow 2% to 5% per month. Technology sector lists grow 3% to 6% per month. Finance sector lists grow 1% to 3% per month. — Shno.co, Email List Growth Statistics 2026
- For mature, established lists, a healthy steady-state growth rate of 1% to 3% per month is considered acceptable — as long as list quality and engagement remain high. — Shno.co, Email List Growth Statistics 2026
- The average annual growth rate for email lists sits around 11% to 25% across industries. — Opensend, Email List Growth Rate Statistics for eCommerce 2025
- Asia-Pacific email list growth averages approximately 18% annually — the highest regional rate globally — driven by e-commerce expansion, younger mobile-first audiences, and rapid digital adoption in India, Indonesia, and Southeast Asia. — Opensend, Email List Growth Rate Statistics for eCommerce 2025
- Nonprofit email lists grew 3% in 2024, following 6% growth in 2022 and 4% in 2023. Growth rates are slowing even in strong-performing sectors. — M+R Benchmarks 2025
- Nonprofit organizations sent an average of 62 email messages per subscriber in 2024 — a 9% increase in volume from the previous year. — M+R Benchmarks 2025
- Strategic popup campaigns generate subscription rate improvements of approximately 137% compared to sites that rely only on passive footer or sidebar signup forms. — Opensend, Email List Growth Rate Statistics for eCommerce 2025
- First-time visitor incentives — like a welcome discount or free download — boost signup conversion rates by around 42% compared to generic newsletter invitations with no offer. — Opensend, Email List Growth Rate Statistics for eCommerce 2025
What the data shows: 2.5% monthly growth sounds modest. Over 12 months, it adds up to roughly 34% list growth — before accounting for decay. The problem is that most businesses are not consistently hitting even that baseline. They grow in bursts and neglect the list in between.
The Leaky Bucket Problem: What List Decay Actually Costs You
This is the stat most email marketers know but very few act on.
Your email list is not static. It is actively shrinking — every single month — whether you are sending emails or not.
The average email list decays by 20% to 30% per year through unsubscribes, address abandonment, and natural churn. — Opensend, Email List Growth Rate Statistics for eCommerce 2025
Email addresses decay at approximately 22.5% annually. People change jobs. They abandon old accounts. They switch providers. An address that was valid 12 months ago has a 1-in-5 chance of being unreachable today. — Opensend via Klaviyo data
For-profit businesses churn approximately 30% of their email list every year. Nonprofits churn slightly less. — CDP Community
In 2024 alone, 9% of subscribers unsubscribed and 7% became non-deliverable due to bouncing — a combined 16% annual loss before any growth effort. — GrowthNavigate, Email Marketing Statistics 2025
Only 35% of marketers regularly delete unengaged subscribers. The other 65% keep inflated list sizes that hurt deliverability, skew open rates, and cost more in platform fees. — GrowthNavigate, Email Marketing Statistics 2025
What this means in practice: If your list has 10,000 subscribers and you do nothing, you will have roughly 7,000 to 8,000 reachable subscribers by next year. To actually grow to 11,000, you need to add at least 3,000 to 4,000 new subscribers just to net a 10% gain. Most businesses that feel like they are “not growing” are actually just breaking even against their own decay rate.
The answer is not to panic. It is to build list growth into every page, every piece of content, and every campaign — not as a one-time project but as an ongoing system.
Opt-In Form and Popup Statistics
Quick Answer: The average email opt-in rate across all websites is 1.95%. Top performers hit 6.5%. The average popup conversion rate in 2025 is 3.49%. Adding a lead magnet to a popup more than doubles that rate — every time.
- The average email opt-in rate across all websites is 1.95%. The bottom 25% of marketers get just 0.8%. The top 25% average 6.5%. — Sumo, Opt-In Rate Study
- The average popup conversion rate in 2025 sits at 3.49%, with an average interaction rate of 7.05% — meaning 7 out of 100 visitors engage with a popup before closing it. — Popupsmart, Popup Conversion Benchmark Report 2025
- Campaigns using time-on-page triggers outperformed all other popup trigger types by up to 25% in conversion rate. — Popupsmart, Popup Conversion Benchmark Report 2025
- A conversion rate below 1.5% means your popup is underperforming the 2025 average. Between 1.5% and 3% is acceptable but needs improvement. Hitting 3% to 8% puts you in line with well-optimized campaigns. Above 8% is top-performer territory. — Popupsmart, Popup Conversion Benchmark Report 2025
- Simpler popups with only 1 to 2 form fields consistently achieve the highest conversion rates. Adding a third field can cut conversions by 25% or more. — Popupsmart, Popup Conversion Benchmark Report 2025
- Popups shown on both desktop and mobile converted at 2.2% in 2025, while desktop-only popups lagged at 1.4%. Mobile-only popups also averaged 2.2%. Optimizing for mobile is now as important as optimizing for desktop. — HelloBar, Email List Building Guide 2026
- Across 1.24 billion popup displays analyzed by Omnisend, the total number of emails collected in 2025 reached 26.4 million — a 44% increase year over year from 18.3 million in 2024. — Omnisend via HelloBar
- Sleeknote added a content upgrade popup to a single blog post and saw their opt-in rate jump from 0.37% to 4.14% — more than a 10x improvement from one change. — Sleeknote, 2025 Study via DigitalApplied
- Contextual popups triggered by scroll depth and dwell time signals achieve a 172% higher conversion rate than generic popups shown to all visitors immediately on page load. — OptiMonk, 85 million impression study via Amra & Elma
- Gamified popups — like spin-to-win wheels — achieve a 13.23% average conversion rate. Seasonal popups hit 11.88%. Feedback popups hit 12.62%. Standard email capture popups without incentives convert much lower. — OptiMonk via HelloBar
- Copy written at a 5th to 7th grade reading level converts at 11.1% on opt-in landing pages — materially higher than 8th to 9th grade copy, and more than double the rate of professional-level writing. Simple language is one of the cheapest available conversion lifts. — Unbounce Q4 2024 via DigitalApplied
- Email traffic converts at 19.3% on lead magnet landing pages versus 11.3% for paid search. Traffic source matters as much as the offer itself. — Unbounce Q4 2024 via DigitalApplied
What the data shows: The difference between a 0.8% opt-in rate and a 6.5% opt-in rate is not luck. It is offer quality, trigger timing, form simplicity, and copy clarity. Every one of those is within your control right now.
Lead Magnet Statistics
Quick Answer: 79.1% of marketers who use opt-in forms pair them with a lead magnet. Adding any lead magnet doubles popup conversion rates. Ebooks are the most popular format, but quizzes, checklists, and video lead magnets often convert better.
- 79.1% of marketers using opt-in forms pair them with a lead magnet — meaning a bare “subscribe to our newsletter” prompt is now very much the exception, not the norm. — Mailchimp Global Email Marketing Benchmarks via Amra & Elma
- 86.3% of marketers with opt-in forms now pair them with a lead magnet in 2026 — up from 79.1% in 2025. The direction is clear: lead magnets are becoming non-negotiable. — Mailchimp Global Email Marketing Benchmarks 2026 via Amra & Elma
- Lead magnets boost popup conversion by 100% to 155%. On mobile, conversion rises from approximately 3.8% to 7.7% when a lead magnet is added. On desktop, it goes from 1.8% to 4.7%. — Getsitecontrol, Popup Statistics Report via Shno.co
- Personalized or role-specific lead magnets see 2.7x higher list retention rates at 90 days compared to generic lead magnet offers. Getting the right lead magnet in front of the right person is more important than the format. — Mailchimp Global Email Marketing Benchmarks 2026 via Amra & Elma
- 75% of marketers who use lead magnets rely on ebooks as their primary format. — Amra & Elma, Lead Magnet Conversion Statistics 2025
- Ebooks account for 39.5% of all gated content demand and grew registrations by 34.5% in 2023. Despite talk of content fatigue, demand for downloadable assets is still growing. — NetLine 2024, via DigitalApplied
- Gated content demand grew 14.3% year over year in 2023, a 77% cumulative rise since 2019. People are still very willing to exchange their email for the right asset. — NetLine 2024, via DigitalApplied
- 47% of marketers find text-based and video lead magnets to be their best-performing opt-in types. Of that group, 73% say short-form video drives higher conversions than long-form content. — GetResponse 2024 Survey via My Codeless Website
- Quizzes report a 40.1% start-to-lead conversion rate and a 65% start-to-finish completion rate on the Interact platform — making interactive lead magnets one of the highest-converting formats available when well-built. — Interact via DigitalApplied
- AI-triggered exit-intent lead magnets offering personalized offers based on cart value and browsing behavior lifted average e-commerce lead magnet conversion from 2.1% to 3.6% — with beauty brands achieving 4.9%. — Klaviyo, 38,000 store study via Amra & Elma
- Webinars convert 57% of registrants to attendees, with 56% joining live and 44% watching on-demand — making them a uniquely high-intent list-building tool because attendees self-select for commitment. — ON24, 2024 Dataset via DigitalApplied
- ROI calculators and interactive tools that deliver a personalized output drove an average of 45% of total pipeline revenue in enterprise accounts when integrated into lead capture flows. — Salesforce and Drift, 1,200 B2B company study via Amra & Elma
- The average time between requesting a piece of gated content and actually engaging with it is 31.2 hours — an 8.8% increase from the previous year. Most ebook downloads are never actually read. High registration rate does not mean high content consumption. — NetLine, 2024, via DigitalApplied
What the data shows: The format of your lead magnet matters less than the specificity and relevance of the offer. A highly specific checklist beats a generic 50-page ebook every time. The best-converting lead magnet is one that solves an exact, immediate problem for a very specific person.
The Lead Magnet Format Comparison: What Converts vs. What Gets Consumed
Most businesses pick a lead magnet format based on what is easiest to make. The data says that is the wrong starting point.
Here is what the research shows about the tradeoff between conversion rate and actual consumption:
| Format | Avg. Conversion Rate | Consumption Rate | Best For |
|---|---|---|---|
| Quiz or assessment | ~40% start-to-lead | Very high (65% complete) | B2C, personality-driven audiences |
| Webinar | 57% of registrants attend | High (live commitment) | B2B, high-intent bottom-of-funnel |
| Checklist or template | 4% to 8% (landing page) | High (practical, quick) | Any audience with a clear process pain |
| Ebook or whitepaper | 2% to 6% (landing page) | Low (31-hour avg. delay) | Top-of-funnel awareness, brand authority |
| Video (short-form) | Highest engagement | High | B2C, visual learners, social-driven traffic |
| ROI calculator | High, especially B2B | Very high (they need the answer) | Mid-funnel decision-stage B2B |
| Free trial or demo | Lower opt-in rate | Very high (product-qualified) | SaaS, bottom-of-funnel |
Sources: DigitalApplied Lead Magnet Conversion Benchmarks 2026, ON24 2024, Interact, NetLine 2024, Popupsmart 2025
The insight from this data that most pages do not spell out: a lead magnet that converts at 40% but never gets opened produces no value. A lead magnet that converts at 5% and gets fully consumed builds a relationship. High consumption rate predicts downstream revenue far better than high opt-in rate.
Choose your format based on what your audience will actually use — not just what they will click to download.
List Decay and Churn Statistics
Quick Answer: The average email list loses 20% to 30% of its subscribers every year. Email addresses go bad at 22.5% annually. The average unsubscribe rate per campaign is 0.20% to 0.22%. But the bigger problem is opaque churn — subscribers who stop opening without ever unsubscribing.
- The average email list decays by 20% to 30% annually through unsubscribes, address abandonment, and natural churn. A brand that stops actively building its list loses roughly a quarter of its audience every year. — Opensend, Email List Growth Rate Statistics for eCommerce 2025
- Email addresses go bad at a rate of approximately 22.5% per year. People change jobs, abandon accounts, and switch providers constantly. — Opensend, via Klaviyo data
- For-profit businesses churn approximately 30% of their email list per year. Nonprofits churn slightly less due to higher subscriber engagement and mission-driven loyalty. — CDP Community, Email List Churn and Decay
- The average ecommerce unsubscribe rate per campaign sits between 0.20% and 0.30%. Rates consistently above 0.35% signal problems with content relevance, email frequency, or audience quality that need immediate attention. — Opensend, Email Unsubscribe Rate Statistics for eCommerce 2025
- The average unsubscribe rate across all industries in 2025 was 0.22% — more than double the 2024 figure of 0.08%, largely because Gmail made one-click unsubscribe more prominent. — MailerLite, Email Marketing Benchmarks 2025
- Promotional emails generate 2x to 3x higher unsubscribe rates than welcome series or post-purchase automated flows, based on Klaviyo data across 400,000 campaigns. — Klaviyo via Opensend
- Over 30% of unsubscribers cite “too many emails” as their primary reason for opting out — the most common single reason across all surveys of email behavior. — Opensend, Email Unsubscribe Rate Statistics for eCommerce 2025
- Implementing a preference center — where subscribers can choose their own email frequency instead of fully unsubscribing — reduces total unsubscribes by 20% to 40%. — Verified.email, B2B Benchmarks Report 2025
- AI-powered segmentation reduces opt-out rates by up to 30% by ensuring subscribers only receive content that matches their stated or inferred interests. — Opensend, Email Unsubscribe Rate Statistics for eCommerce 2025
- Only 35% of marketers regularly clean their lists by deleting unengaged subscribers. The other 65% carry inflated subscriber counts that cost more in platform fees and hurt deliverability scores. — GrowthNavigate, Email Marketing Statistics 2025
- Brands that own their subscriber data and maintain strong list hygiene achieve 16% higher annual email revenue than those who do not actively manage list quality. — Opensend
What the data shows: Churn is not a sign of failure — it is a sign that email is working the way it should. People who stop caring about your content should leave. The problem is not churn. It is not replacing churned subscribers with new, engaged ones fast enough.
What Is Each Email Subscriber Actually Worth?
Quick Answer: Nonprofit subscribers generate an average of $2.63 in email revenue per year. E-commerce brands can reach $1 or more per subscriber per month. The value of a subscriber compounds over time — but only if you keep them engaged.
- Nonprofit organizations achieved approximately $2.63 in email-sourced revenue per subscriber in 2024. — M+R Benchmarks 2025
- For every 1,000 fundraising emails sent, nonprofits raised $58 in 2024 — a 10% decrease from 2023. — M+R Benchmarks 2025
- B2B coaching and education businesses can achieve $1 or more per subscriber per month in direct email revenue — roughly $12 per subscriber per year, making list building a clearly trackable revenue investment. — Shno.co, Email List Growth Statistics 2026
- If your average subscriber value is meaningfully higher than your average subscriber acquisition cost, it makes financial sense to invest more aggressively in list growth. — CXL, Email Marketing KPIs
- Over 60% of retailers worldwide report that email marketing generates the highest return of any digital marketing channel — including paid search, paid social, and influencer campaigns. — Opensend, Email List Growth Rate Statistics for eCommerce 2025
- Brands that implement segmented campaigns see a 23% higher average open rate than non-segmented ones — which compounds directly into higher revenue per subscriber over time. — HelloBar, Email List Building Guide 2026
- Automated emails — the welcome sequences, abandoned cart flows, and post-purchase series triggered by list behavior — made up just 2% of total email volume in Omnisend’s 2025 data but generated 37% of all email-driven sales. — Omnisend, 2025 Ecommerce Marketing Report
What the data shows: A subscriber who is segmented, welcomed properly, and followed up with automated sequences is worth dramatically more than one who just sits on a list receiving broadcast emails. The list size matters far less than what you do with the list after someone joins.
What Separates Fast-Growing Email Lists From Stagnant Ones
I have looked at a lot of email list building data. The gap between a 0.8% opt-in rate and a 6.5% opt-in rate — between a list that loses subscribers faster than it gains them and one that compounds steadily — almost always comes down to the same five things.
They offer something specific, not something generic. The difference between “subscribe to our newsletter” and “download the exact checklist I used to grow my list from 0 to 10,000” is conversion rate. Generic opt-in prompts get 0.8%. Specific, high-value offers get 6.5%. The research is consistent.
They use triggered popups, not timed ones. Popups triggered by scroll depth and dwell time convert 172% better than generic popups shown to all visitors immediately. Fast-growing lists show the right offer at the right moment — after someone has read enough to want more.
They build from their best-performing content. Sleeknote added one content upgrade to one blog post and went from 0.37% to 4.14% opt-in rate. Fast-growing lists are built on top of content that is already working. They do not try to get email signups on pages no one is visiting.
They treat list cleaning as growth strategy. This is counterintuitive. Removing dead weight from your list improves deliverability, which improves inbox placement, which improves open rates, which improves your sender reputation for everyone else on the list. Brands with cleaner lists reach more inboxes and generate 16% more email revenue annually. List hygiene is not maintenance — it is a growth lever.
They have a welcome sequence. The moment someone joins your list is the highest-engagement moment you will ever have with them. Automated welcome sequences that capitalize on that moment generate 37% of all email-driven sales despite being just 2% of total email volume. Fast-growing, high-revenue lists are built on sequences, not one-off sends.
4 Email List Building Myths the Data Disproves
Myth 1: A bigger list is always better.
A list of 50,000 disengaged subscribers performs worse than a list of 5,000 engaged ones. 65% of marketers carry inflated lists full of inactive contacts that drag down open rates, hurt deliverability, and cost money in platform fees. List quality beats list size in every metric that matters for revenue.
Myth 2: People do not want to give out their email anymore.
Gated content demand grew 77% cumulatively between 2019 and 2023. Ebook registrations grew 34.5% in one year. 90% of Americans are on at least one newsletter list. People are not reluctant to share their email — they are reluctant to share it for something generic or low-value. Give them a reason. They will sign up.
Myth 3: Social media is replacing email lists.
Email converts at 4.24%. Social media converts at 0.59%. That is not a close race. And unlike social followers, your email list cannot be taken from you by a platform policy change, an algorithm update, or an account ban. Four out of five marketers say they would rather give up social media than email. The data agrees with them.
Myth 4: You only need to grow the list — decay takes care of itself.
Every email list loses 20% to 30% of its subscribers annually just through natural churn. A list of 10,000 today is closer to 7,000 reachable subscribers in 12 months if you do nothing. Decay does not take care of itself. You have to grow faster than you lose, every month, with a consistent system — not a one-time campaign.
Email List Building Statistics: Key Takeaways
Here is everything this data comes down to in plain language:
Your list decays whether you grow it or not. 22.5% of email addresses go bad every year. 30% of your list will effectively disappear by this time next year through some combination of unsubscribes, bounces, and abandonment. Growth is not optional — it is the minimum required just to maintain what you have.
The opt-in rate gap is entirely about the offer. The best performers get 6.5% opt-in rates. The worst get 0.8%. That is not a technology gap. It is an offer gap. Specific, high-value, immediately useful lead magnets convert. Generic newsletter prompts do not. This is the single highest-leverage thing most businesses could fix today.
What happens right after the signup determines the long-term value. Automated welcome sequences generate 37% of all email-driven sales from just 2% of total email sends. The moment of signup is your highest-attention moment. Waste it with a confirmation email and nothing else and you will pay for it in long-term churn.
Lead magnet format matters less than lead magnet specificity. Quizzes convert at 40%. Ebooks convert at 2% to 6%. But a highly specific ebook that solves a real problem outperforms a generic quiz every time. Conversion rate and consumption rate are different metrics. Build for consumption first.
List quality beats list size — every single time. A clean, engaged, segmented list of 5,000 people will outperform a bloated, unmanaged list of 50,000. Deliverability improves, open rates improve, revenue per subscriber improves. The businesses winning at email are not the ones with the biggest lists. They are the ones with the most engaged ones.
About This Page
How I collected this data: Every statistic on this page comes from a named research study, published benchmark report, or platform analysis. I linked to the closest available version of the original source next to each number.
When this was last updated: June 2026.
How to cite this page: If you reference data from this page in your own content, please link back to Mailotrix.com as the source. That helps us keep building free, research-backed resources like this one.
Want to put this data to work? Read our full guide on email list building strategies and our breakdown of the best lead magnet ideas that actually convert. Or compare email marketing platforms to find the one built for serious list growth.
